Scatter plots are often used to see if an association, or correlation, exists between two variables.
If the data points are clustered about a line or curve, they have a linear or nonlinear association, respectively.
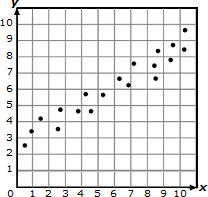
linear association | | 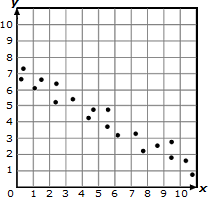
linear association |
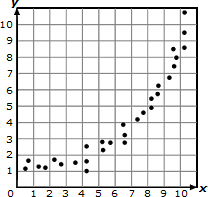
nonlinear association | | 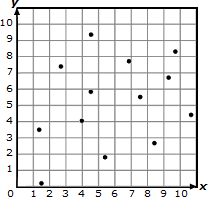
no association |
If a linear association exists, an equation can be developed to model the relationship.
The equation can be used to make predictions about the data.
The equation is derived from a straight line drawn to fit the data.
This line is referred to as a trend line, line of best fit, and/or regression line, and it can be used to make predictions outside of the data set.
The number of classes is shown on the x-axis, and the cost per class is shown on the y-axis.
Use the best fit line on the scatter plot to find the x-value when y equals 10.
The x-value of the point on the line where y equals 10 is about 38.
So, the best estimate of the number of classes that must be purchased for each class to cost $10 is 38 classes.


 8th Grade Math - Scatter Plots Lesson